

As you might have guessed, now you can! You can look at a single product, you can look at multiple products simultaneously, or you can even join products for a total unit count – all sortable by the date range of your choosing.
Transactions vs Units Sold
They tell two very different stories. One sheds light on customers and repeat customers. The latter, provides insights around upsells and average transaction size. Both are important, but since our users already had order counters, we saw fit to deliver a report template on Units Sold.
Check out the video below to see just how easy this report is to set up.
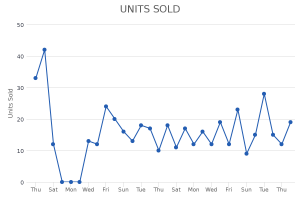
Units Sold
Happy Charting,
Team Graphly
P.S. This coming Monday I’ll be sharing a sobering hand drawn chart that has to do with recurring revenue. More importantly, I’ll be sharing 7 key metrics to have in place when building a recurring revenue business. If you haven’t seen our new series, Hand Drawn Charts, check it out now.


