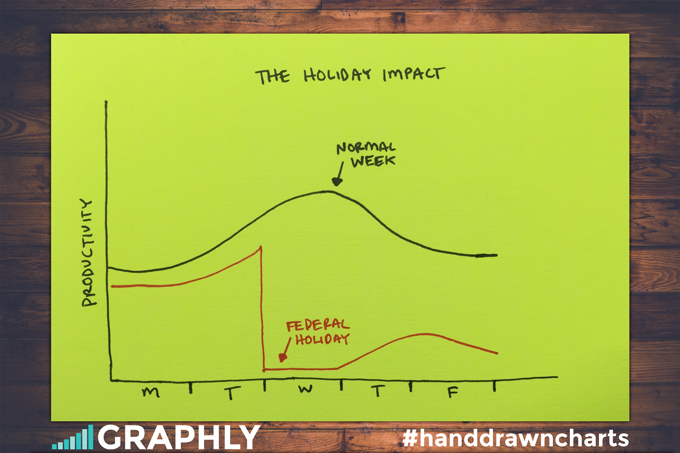
The chart above is a depiction of what commonly occurs for businesses who close their doors on holidays and send their employees packing.
A couple of weeks ago, American businesses celebrated the nation’s Independence Day. How did the holiday impact your business? Specifically, what happened before, during and after the holiday?
Holiday Norms
It’s not abnormal to see a loss in productivity outside of the holiday itself, and the severity of the loss varies depending on the holiday. Some holidays bring with them more distractions, more partying or more time demands than others. All too often these things can negatively impact focus and your team’s ability to get things done.
But how could we possibly know a holiday’s impact on a work week? Heck, how can we accurately measure the productivity of a normal work week? The Holiday Effect not only sheds light on productivity in the workplace around holidays, it inspires us to search for patterns (uncovered by data) that once discovered, allow us to take meaningful action for positive gains.

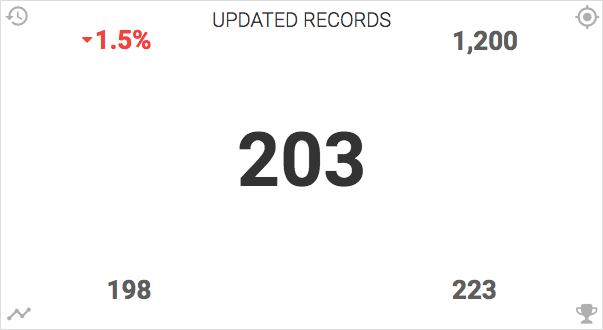
With Graphly, the process is really quite easy. With the ability to see updated contacts, opportunities, tasks, notes, appointments and orders, there’s no guessing which employees are working on which days and what results they’re getting.
Comparing lead generation and sales revenue from the previous year helps you begin to understand the seasonality of your business. Not the seasonality of the industry. The seasonality of your business. If you know from measuring the last couple of years that the first 3 weeks of August are slow, what can you do to improve or adjust for that?
Perhaps you run a promotion in August. Perhaps you increase ad spend in July so your pipe is more full. Perhaps you take the time off because nothing can be done to change it (not likely, lol). The point is, data will reveal patterns, problems and positive wins that will empower you to make simple decisions that are usually quite difficult if not impossible to make correctly with out the data. So use the data.
Happy Tracking!


