Since the launch of Graphly more than 4 years ago, there has been one report that has risen above the rest in popularity. Regardless of the niche or industry that a business operates in, we often see this same report on dashboard after dashboard. What is it you ask? It is the Tag Funnel report.
While many Graphly users build out funnel reports with 5+ steps being represented by tags, there are others who have a two-step funnel. In other words, the report is measuring the conversion from step 1, to step 2.
A while back we were contacted by Sixth Division (a renowned Keap Certified Partner) regarding their implementation process of Keap and the reporting they desired to provide their clients with. Out of those conversations came a pretty cool collaboration that culminated in two new reports. Reports similar to our Tag Funnel in the data they provide, but with a laser-focused view of the conversion of a single step inside your funnel.
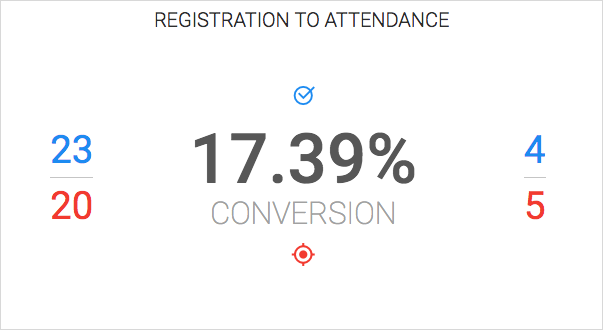
That’s your sneak peek, but before we talk about the reports, I want to let Justin McDonald (aka JMac), the President of Sixth Division explain their implementation method. This is probably where you want to pull out a pencil and some paper to take notes 😉
The Game Plan
We really appreciate JMac taking the time to break down for our users/readers, their approach to creating game plans. It all starts with defining your overall goal and then setting individual (realistic) targets to help you achieve the ultimate goal. I love it!
Before Graphly, generating these reports was a painstaking process. Looking up saved searches in Keap, updating spreadsheets, emailing clients. Now there’s a beautiful dashboard that organizes the data in a way that matches the gameplan perfectly, that updates automatically and is easy for the client to understand. How much time can Graphly save you by putting the numbers you need most right in front of you on the daily?
Here’s a look at just how easy these reports are to set up:
Tag to Tag Conversion
Grouped Tag to Tag Conversion
Remember, because tags can be used universally, tag conversion doesn’t always have to equate to measuring funnels. Sure, that was the focus of today’s training, but that’s just one application. The Tag to Tag Conversion report can be used for onboarding new customers, onboarding employees, or just about any other process or system in your business that uses tags to track and monitor a particular flow. Hope you received value from today’s post and that you’ll implement these reports in your overall strategy.
Happy Charting!
