

The Unit’s Sold template allows you to see the number of Units Sold for each product you select over a given date range. This data is especially helpful for those of you who sell more than one quantity of a single product in a single transaction.
Search for the Units Sold Template
To begin, click the “+” icon on the Dashboard and type units into the search bar. Then click on the “Units Sold” widget box.
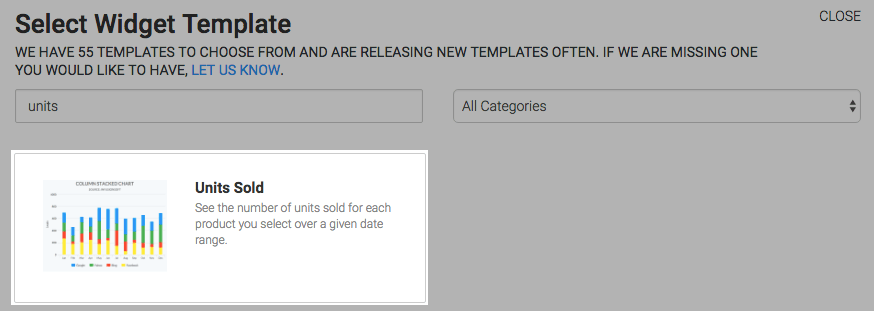
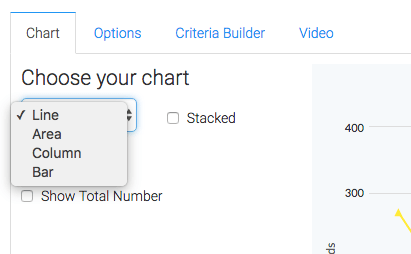
Chart Tab
There are four options for the chart type. I’ll select Line.
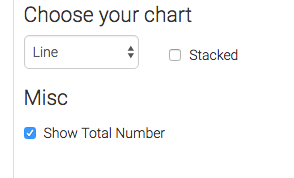
Then click on the Show Total Number box to display the total number in the top right-hand corner of the chart.
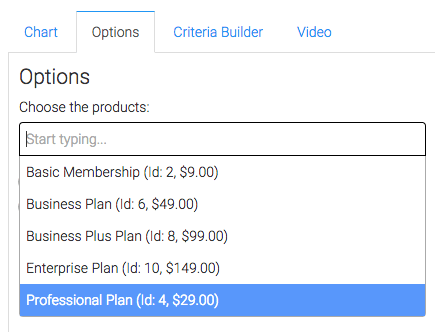
Options Tab
Now navigate to the Options tab and select the products you would like to see from the products field.
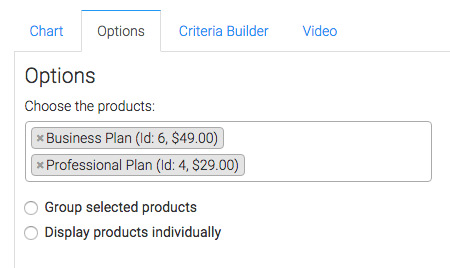
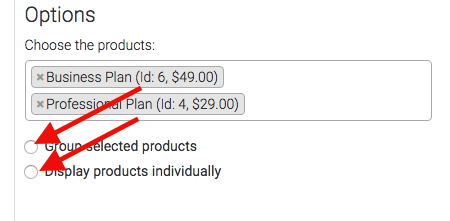
Here you can either group the selected products together, or you can choose to display them individually.
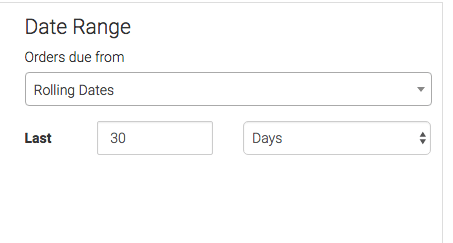
Then select your date range.
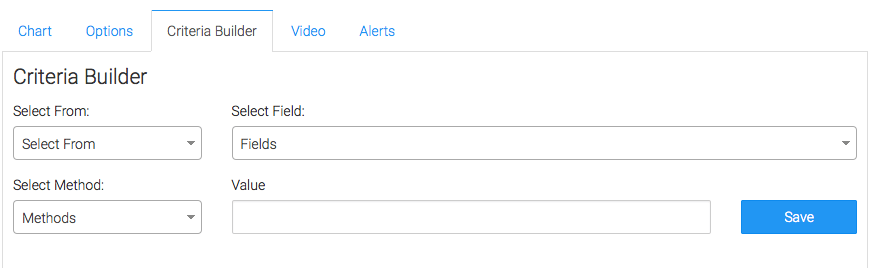
Criteria Builder Tab
For ultimate control and customization, use the Criteria Builder to include additional rules and requirements to the report.
Once you have your everything set, click Save Preferences on this Widget.


