

The Tag Totals template shows the total number of contacts that have a specific tag or tags.
Search for the Tag Totals Template
To begin, click the + icon on your dashboard and search for the words tag totals in the search bar.
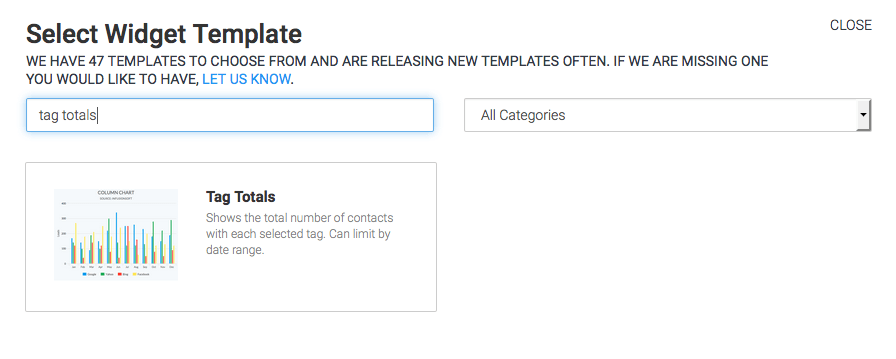
Chart Tab
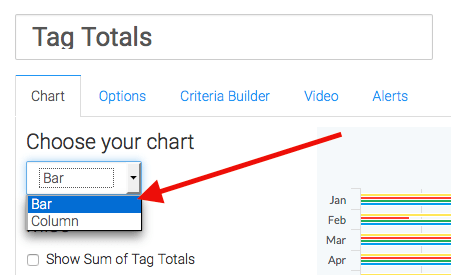
Display Type
First, select your Display type. In this example I’ll select bar.
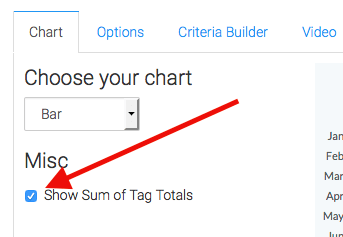
Miscellaneous
By selecting the check box Show Sum of Tag Totals, you will see the sum of all the tag totals for each tag you select.
Options Tab
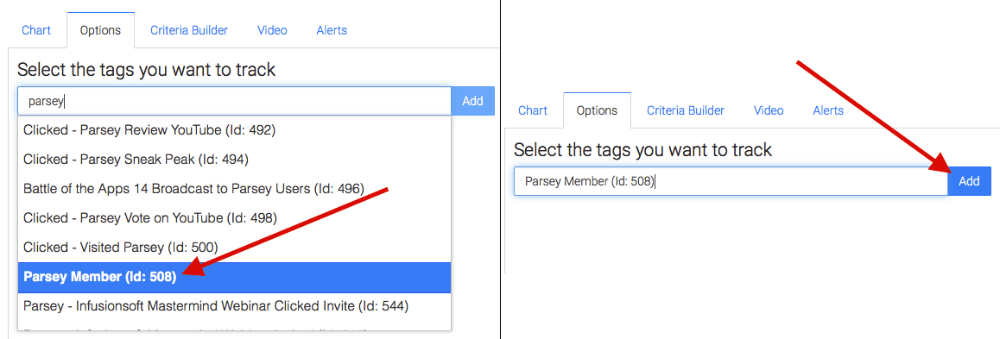
Select Tags
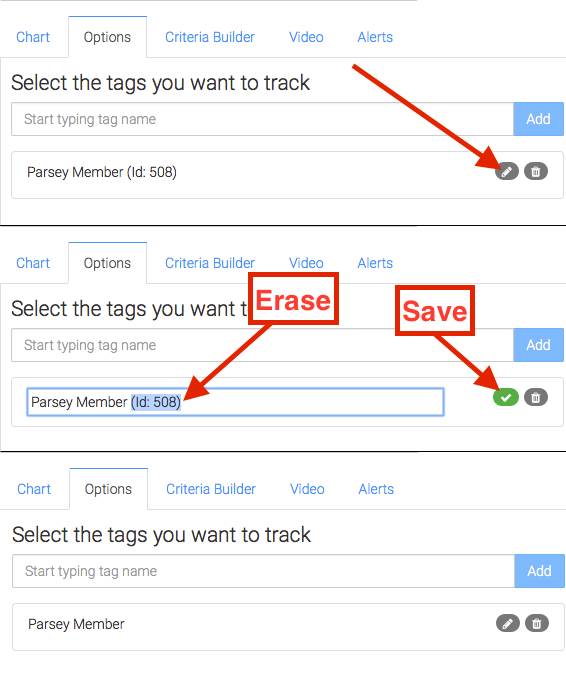
On the Options tab, Simply type in the tag(s) you would like to include and click Add.
Click the pencil icon to edit the display label for the tag within the widget.
Criteria Builder
Date Range (Optional)
If you stop now, you will see a count for your tags. Not taking into account any sort of time frame. If you’d like to specify a date range for when the tags were applied, go to the Criteria Builder tab. Select from Tags >> Tag Applied >> Choose your Date method.
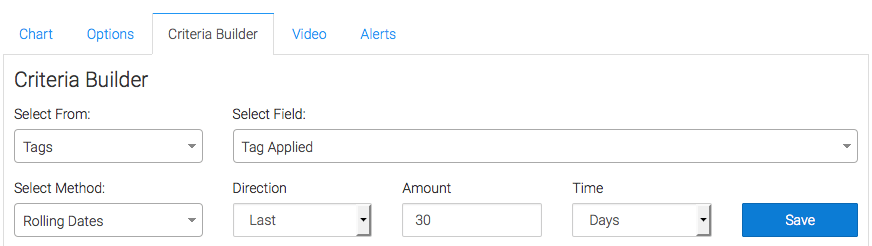
For ultimate control and customization, continue using the Criteria Builder to include additional rules and requirements to the report.
Relevant Articles
- How to Set Up the Compare Tags Report
- How to Set Up the Grouped Tags Funnel Report
- How to Configure the Grouped Tags Applied Report
Don’t have Graphly account yet? Sign up for free now to start gaining valuable insight into your Infusionsoft Data!


