If you have ever wanted to see the tags that are getting applied the most, this report is for you. The Tag Leaderboard template shows the leaderboard sorted by tags that were applied during a certain date range.
Configuring the Tag Leaderboard Report
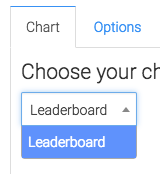
As usual, to start, click on the add icon in the top-right of the Graphly dashboard to bring up the search box for reports. Here you should type in “leaderboard and choose the Tag Leaderboard widget. Once the report settings pop up, you should be in the chart tab. You’ll see that the only chart type is Leaderboard.

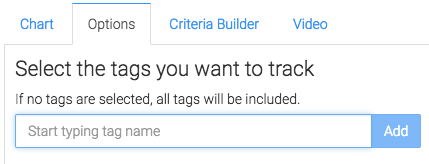
Now let’s head over to the “Options” tab. First, we need to select all of the tags that we want to track in this leaderboard.

On the right side of the Options tab, we can determine the number of leaders we’d like to see. This will determine how many results we see.

Criteria Builder
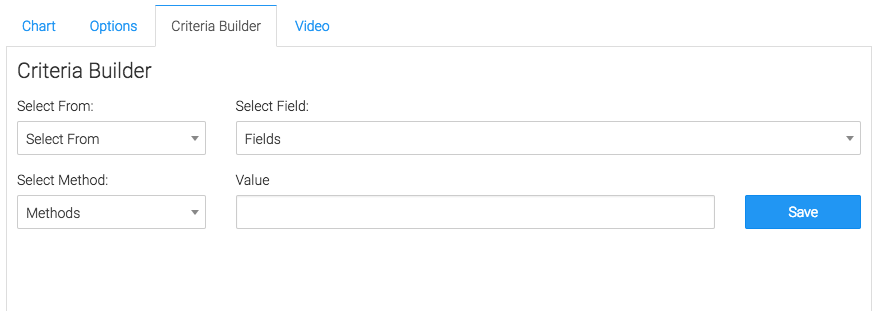
For ultimate control and customization, use the “Criteria Builder“. Using the criteria builder, you can filter your data by any field inside the contact record.

You’ve successfully set up this report! If you like our reporting, let us know by leaving a good review on the Infusionsoft store!


