

This template shows the stick rate of existing customers grouped by successful billing cycles.
Chart Tab
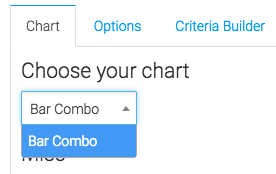
Chart Type
From the chart type, you’ll see that this is a bar combo.
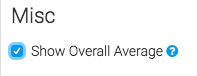
Miscellaneous
Below that, we have the ability to show the overall average by checking this box.
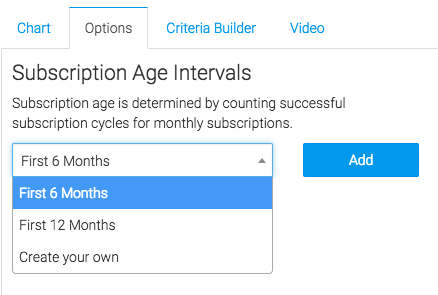
Options Tab
Now let’s go to the Options tab.
Age Intervals
First, we will select the intervals we wish to look at.
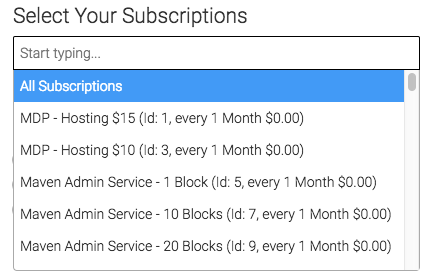
Subscriptions
Next, we will select the subscriptions we would like to measure.
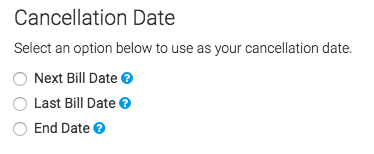
Cancellation Date
Finally, we will select our cancelation date. Choose Next Bill Date if customers pay in Advance for your services. Choose Last Bill Date if customers pay for services after they have been rendered. Select End Date only if you specify manually when a customer’s subscription has ended.
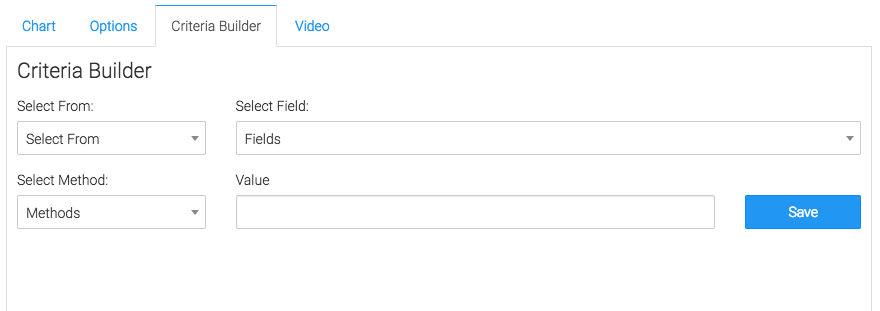
Criteria Builder Tab
For ultimate control and customization, use the “Criteria Builder“.
Relevant Articles
If you don’t already have a Graphly account, you can sign up for free here to get powerful Infusionsoft reporting.


