This template displays the rate of revenue growth for each interval over a given date range.
Setting Up the Revenue Growth Rate Report
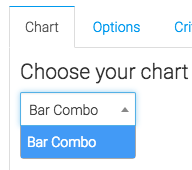
First, you’ll need to click the add icon in the top right corner of the Graphly Dashboard and search for “revenue growth”. Then click on the report to open the configuration options. In the chart tab, you’ll see that the only chart type is Bar Combo.
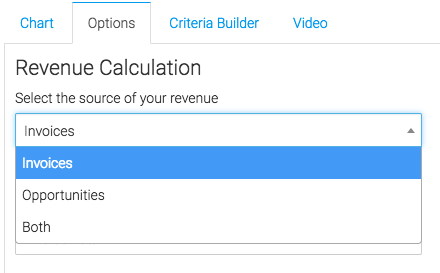
Now let’s go to the “Options” tab. Here, you’ll want to decide how we want to calculate the revenue.
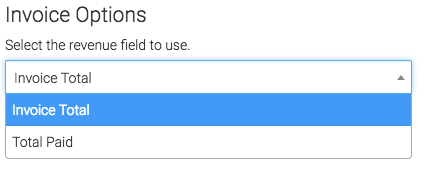
Under the Invoice options you can choose between total invoice and total paid.
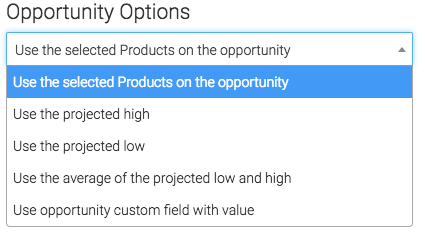
Then, under the opportunity options, we can count revenue in various ways.
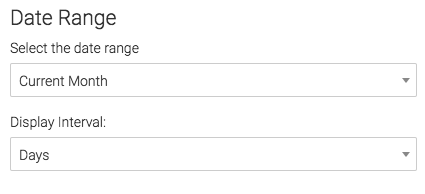
Now we need to select our date range for the report.
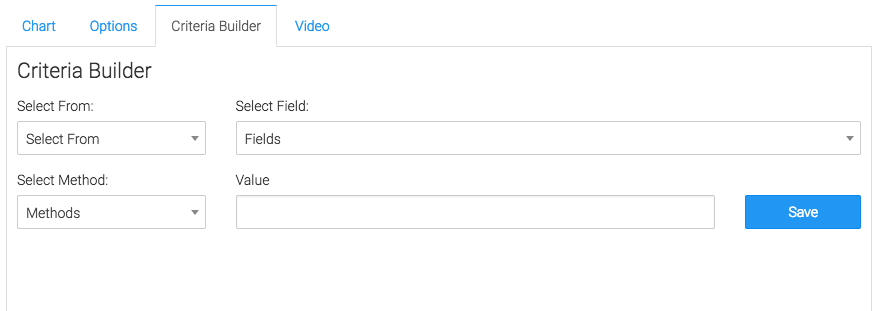
Criteria Builder
For ultimate control and customization, use the “Criteria Builder“. This allows you to filter results by any field in the contact’s record. For instance, you may want to calculate revenue by a certain product.
Once you’ve set this report up, it’s time to check out our other revenue reports. If you like our reporting, let us know by giving us a review on the Infusionsoft store!


