

The Pipeline Digression template shows backwards movement of opportunities in the sales process, giving you an idea of which leads may need extra attention.
Select the Template
To begin, click the “+” icon on the Dashboard and type digression into the search bar. Then select the Pipeline Digression template.
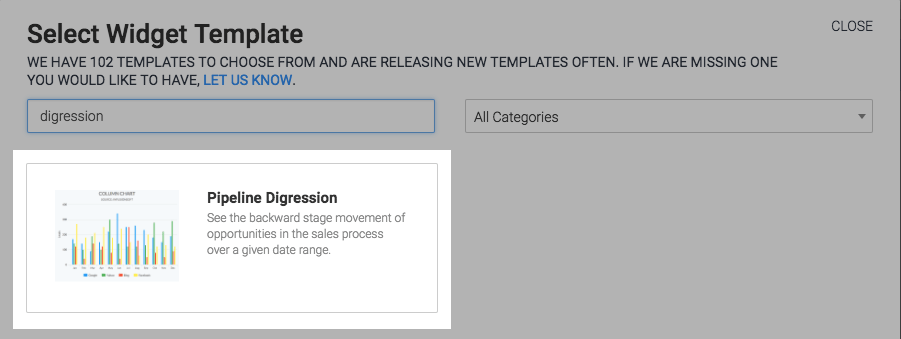
Chart Tab
The Chart tab is where the appearance settings of the report live.
Display Type
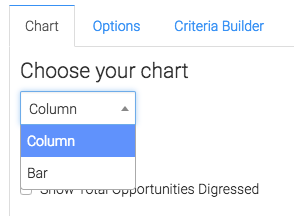
Under Choose your chart, you can choose to view the report as a column or bar chart.
Miscellaneous
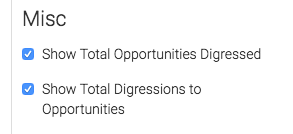
Under miscellaneous, click on Show Total Opportunities Digressed and Show Total Digressions to Opportunities to display them on the top right corner of the chart.
Options Tab
In the Options tab you will define the specifics of the report, and what data it will contain.
Stage Selection
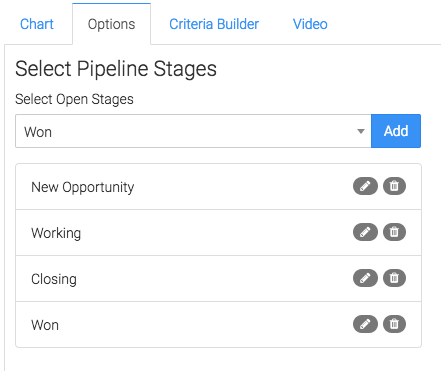
In the Options tab select the open stages you wish to track.
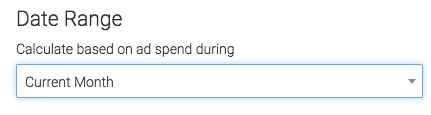
Date Range
Select the date range you wish to see for the generated results.
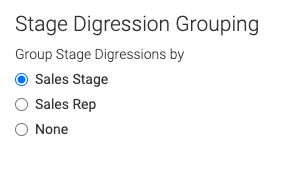
Grouping
Now select how you would like the digression displayed by clicking Sales Stage, Sales Rep, or None.
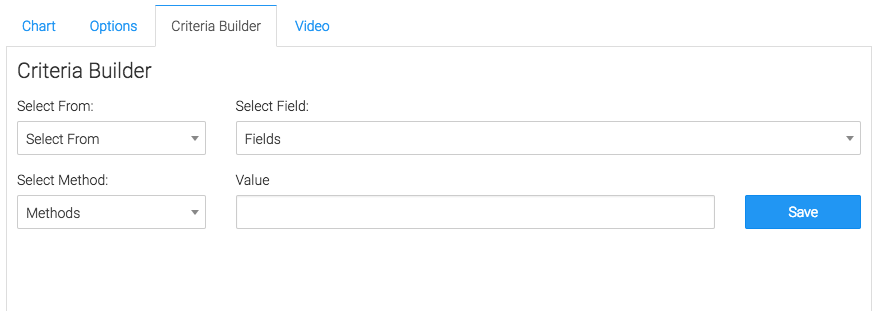
Criteria Builder Tab
For ultimate control and customization click the Criteria Builder tab. The Criteria Builder allows you to filter the results by a field or tag value, allowing you to get hyper-specific results.
Relevant Articles
- How to Configure an Opportunity Attribution Report
- How to Configure an Opportunity Pipeline Summary Report
- How to Configure a Days Between Contact and Opportunity Report
Don’t have Graphly yet? Sign up now to start gaining valuable insight into your Infusionsoft Data!


