

The Order Attribution template allows you to measure specific sources, campaigns, mediums, audiences, and ads responsible for orders being created in your Infusionsoft account.
DISCLAIMER: To get the greatest value from this report, you must have Graphly’s Web Tracker set up and be utilizing UTM parameters in all of your links; whether they’re emails, ads, social posts, etc.
Search for the Order Attribution Template
To begin, click the “+” icon on the Dashboard and type “order attribution” into the search bar. Then click on the “Order Attribution” template.
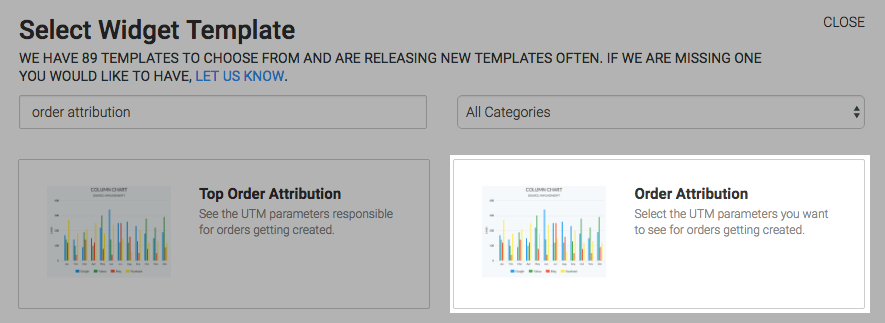
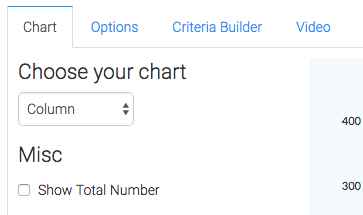
Chart Tab
There are two chart types, column and bar.
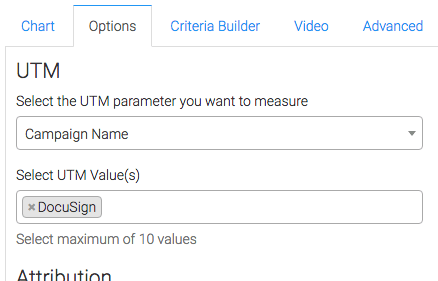
Options Tab
Now navigate to the Options tab and select the UTM parameter you want to measure as well as the UTM value.
Then select whether you want attribution measured by the Most Recent UTM or Original UTM.
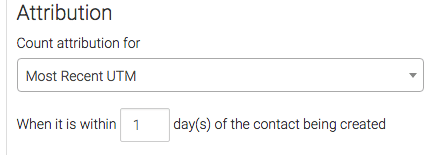
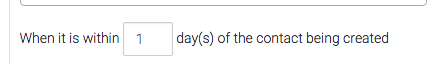
You can also limit the time frame in which we attribute credit to a particular UTM.
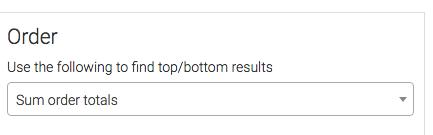
Next, define what your looking for in the results. Here you can choose Count the number of orders, Sum order totals, or Sum total amount paid on order.
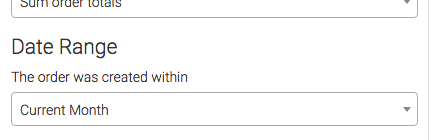
Then choose your date range.
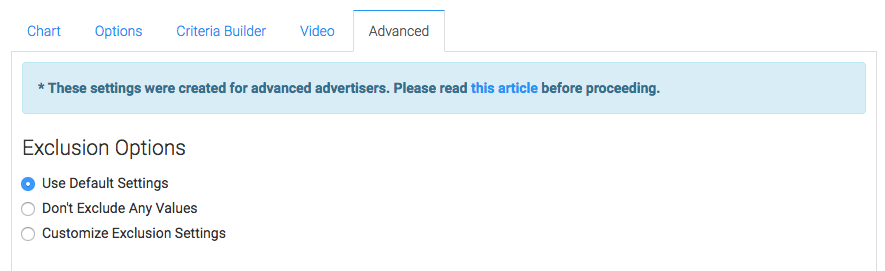
Advanced Tab
Lastly, this report also has an Advanced tab for seasoned advertisers who really want to customize the logic of how top results or bottom results are calculated. Most users will choose “Use Default Settings“.
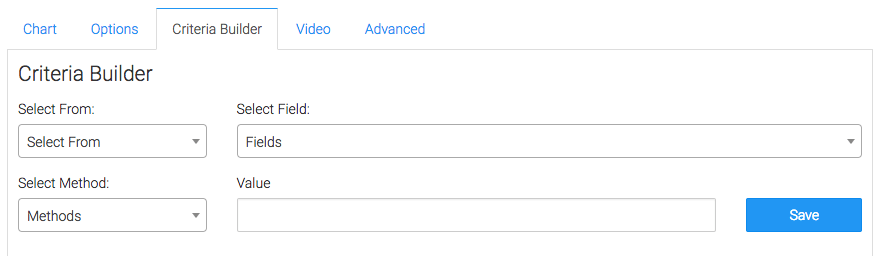
Criteria Builder Tab
For ultimate control and customization, use the Criteria Builder to include additional rules and requirements to the report.
Once you have your everything set, click Save Preferences on This Widget.
Relevant Articles
- How to Configure an Opportunity Attribution Report
- How to Configure the Lead Attribution Report
- How to Configure the Top Tag Attribution Report
Create Your Free Graphly Dashboard
You don’t need to struggle to find the data you need from your Infusionsoft or Keap application. Create a free visual dashboard using the Graphly Lite plan. Using Graphly Lite, you get 1 user, 2 dashboards, and access to our 10 most widely used report templates. These templates include:
- Tags Applied
- Tags Applied Goal
- Leads
- Gross Revenue
- Appt | Note | Task Summary
- Email List Health
- Refunds
- Campaign Email Stats
- Text Widget Area
If you don’t already have a Graphly account, click here to get a Graphly Lite account so you can start making more informed decisions and grow your business.


