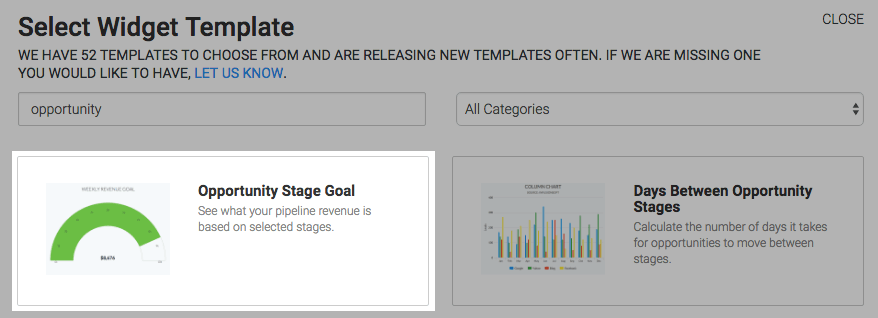
This template displays your pipeline revenue by Opportunity Stage.
Setting Up the Opportunity Stage Goal Report
To begin, click the “+” icon on the Dashboard and type “opportunity” into the search bar. Select the “Opportunity Stage Goal” template.
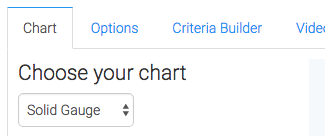
You should start in the chart tab. You will see that there is only one chart type which is Solid Gauge.
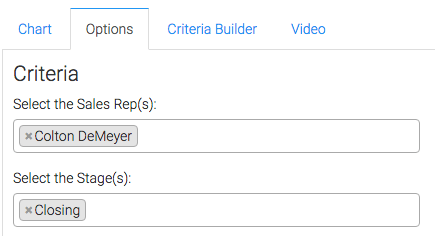
Click on the “Options” tab and select the Sales Rep(s) and Sales Stage(s) that you’d like for this report.
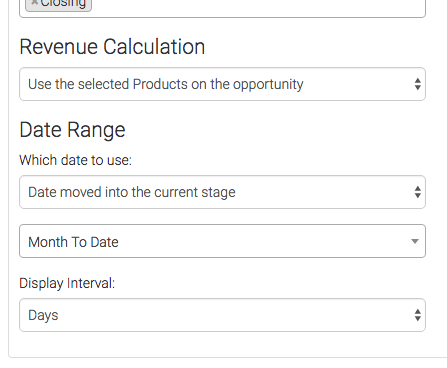
Next, you can choose how you want your revenue to be calculated. You will also need to select a date range for the data.
Then specify the goal that you would like to achieve.

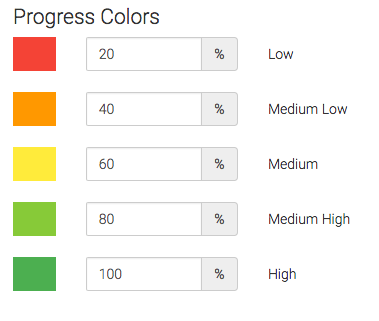
Under the Progress Colors section we can tweak the percentages that will display different colors on the gauge.
Criteria Builder
For ultimate control and customization, use the “Criteria Builder” to include additional rules and requirements for the report. You can use this to filter the data by any field on the contact record.

Once you have your everything set, click “Save Preferences” on This Widget. Now that you’re done, let us know how we’re doing by leaving a review on the Infusionsoft store!
