

The Opportunities Won & Forecasted template is used to produce reports around opportunities you’ve closed and that are in a won status as well as forecast opportunities that will hopefully be in a won status in the future.
Search for the Opportunities Won & Forecasted Template
To begin, click the “+” icon on your Dashboard and type “opportunities” in the search bar. Then select the “Opportunities Won & Forecasted” template.
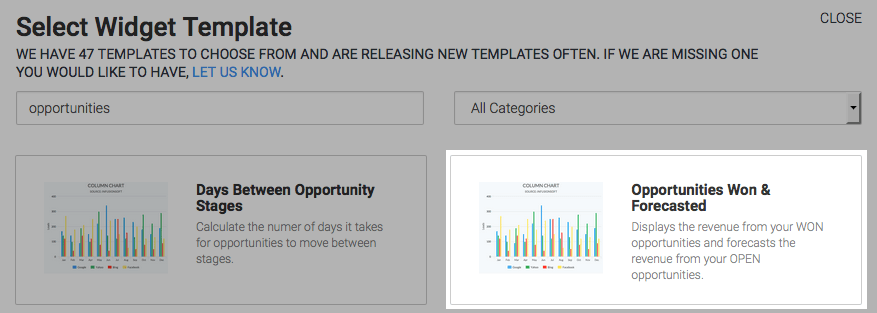
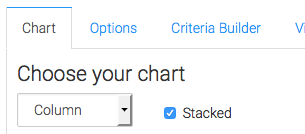
Chart Tab
There are four chart types to choose from. I will choose column. You can also choose to see the data stacked by checking the “Stacked” box.
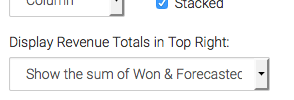
You have the option to show some revenue up in the top right-hand corner of the chart. There are four options for this.
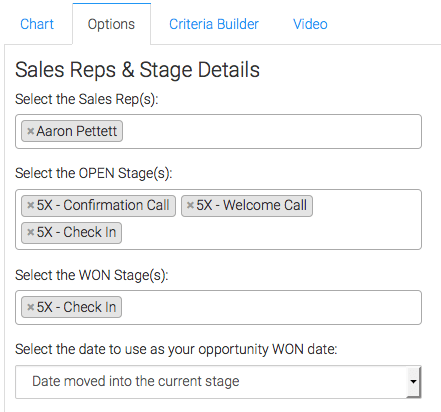
Options Tab
Navigate to the Options Tab and select the Sales Rep(s), WON Stage(s), OPEN Stage(s), and the date to use as your opportunity WON date.
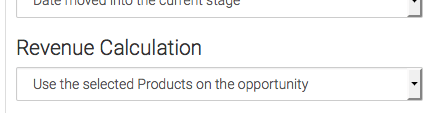
Next, choose your revenue calculation.
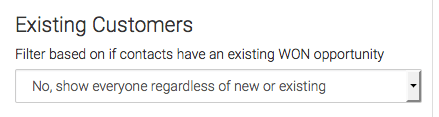
Next, choose the Existing Customer settings.
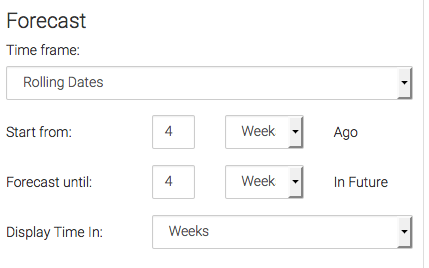
Now choose your Forecast options.
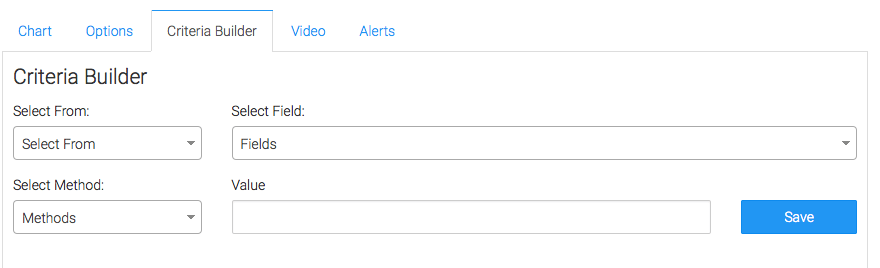
Criteria Builder Tab
For ultimate control and customization, use the Criteria Builder to include additional rules and requirements to the report.
Once you have everything set, click Save Preferences on This Widget.
Relevant Articles
- How to Configure the Opportunity Stage Goal Report
- How to Set Up the Opportunity Funnel Report
- How to Set Up the Days Between Opportunity Stages Report
Create Your Free Graphly Dashboard
You don’t need to struggle to find the data you need from your Infusionsoft or Keap application. Create a free visual dashboard using the Graphly Lite plan. Using Graphly Lite, you get 1 user, 2 dashboards, and access to our 10 most widely used report templates. These templates include:
- Tags Applied
- Tags Applied Goal
- Leads
- Gross Revenue
- Appt | Note | Task Summary
- Email List Health
- Refunds
- Campaign Email Stats
- Text Widget Area
If you don’t already have a Graphly account, click here to get a Graphly Lite account so you can start making more informed decisions and grow your business.


