

The New Customer Value template displays the front-end value of new customers.
Search for the New Customer Value Template
To begin, click the “+” icon on the Dashboard and type “new customer” into the search bar. Then click on the “New Customer Value” template.
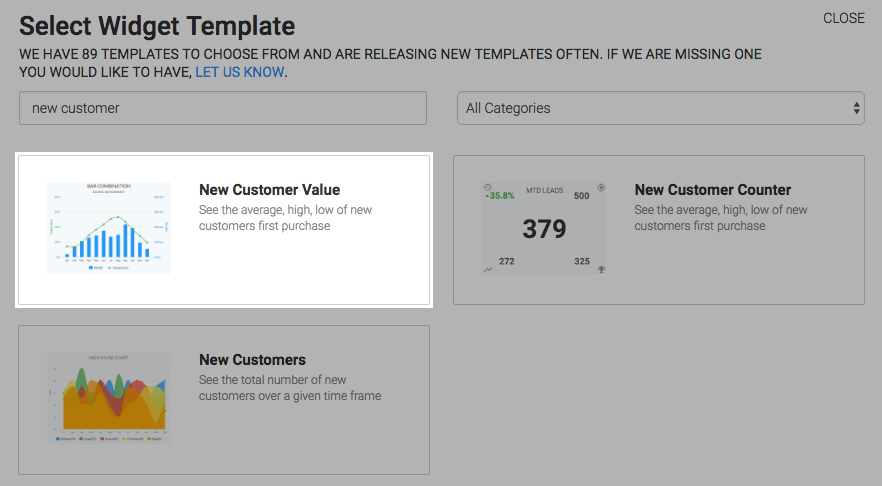
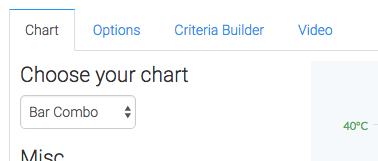
Chart Tab
The only chart type for this report is the Bar Combo.
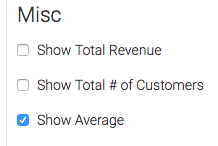
You also have the options to display the Total Revenue, Total # of Customers, and Average in the top-right hand corner of the chart.
Options Tab
Now navigate to the Options tab and define what a new customer is to you.
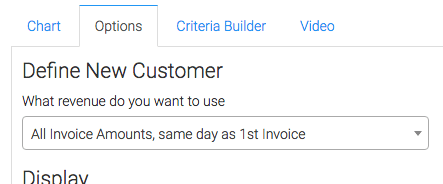
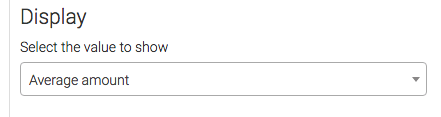
Then select the value you wish to display as the columns.
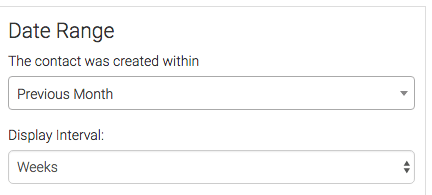
Next, choose your date range.
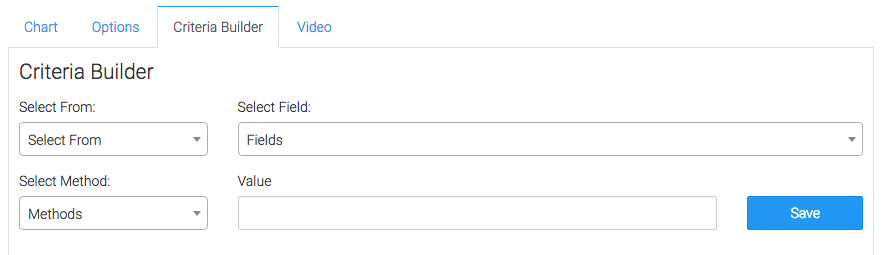
Criteria Builder Tab
For ultimate control and customization, use the Criteria Builder to include additional rules and requirements to the report.
Once you have your everything set, click Save Preferences on This Widget.
Relevant Articles
- How to Set Up the New Subscriptions Revenue Goal Report
- How to Set Up the New Customers Report
- How to Set Up the Subscriptions Started Report
Create Your Free Graphly Dashboard
You don’t need to struggle to find the data you need from your Infusionsoft or Keap application. Create a free visual dashboard using the Graphly Lite plan. Using Graphly Lite, you get 1 user, 2 dashboards, and access to our 10 most widely used report templates. These templates include:
- Tags Applied
- Tags Applied Goal
- Leads
- Gross Revenue
- Appt | Note | Task Summary
- Email List Health
- Refunds
- Campaign Email Stats
- Text Widget Area
If you don’t already have a Graphly account, click here to get a Graphly Lite account so you can start making more informed decisions and grow your business.


