

The Tag to Tag Leaderboard shows a leaderboard of contacts grouped by a field of the conversion from one tag to another over a selected date range. This report would be great for someone who needs to display the sales reps who get the most customers to start and complete specific steps within a time frame.
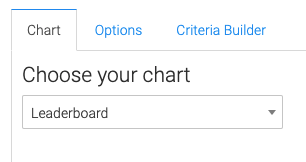
Chart Tab
The only display type for this report is Leaderboard.
Options Tab
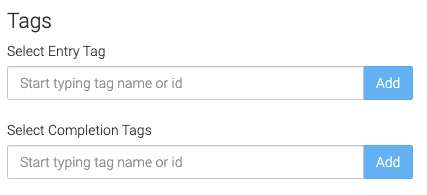
Tags
Select your entry and completion tags.
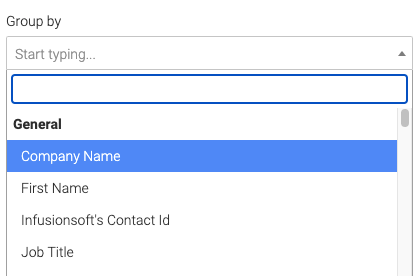
Group By
Select the field that you want to group the contacts by.
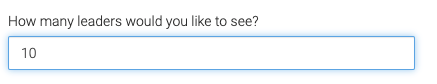
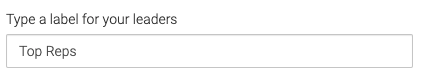
Leaders
Choose the method that will determine who the leaders are.
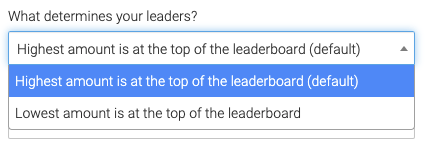
Select how many leaders you want to see, and type what they are called.
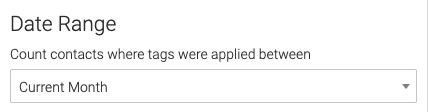
Date Range
Select the date range for the tags being applied in this report.
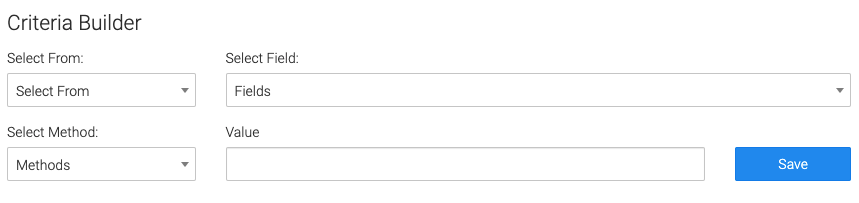
Criteria Builder Tab
For Ultimate control and customization, use the Criteria Builder to set additional rules and requirements for the report.
Relevant Articles to Tag to Tag Leaderboard
- How to Set Up the Tag Leaderboard Report
- How to Set Up the Contact Leaderboard Report
- How to Set Up the Opportunity Funnel Report
Create Your Free Graphly Dashboard
You don’t need to struggle to find the data you need from your Infusionsoft or Keap application. Create a free visual dashboard using the Graphly Lite plan. Using Graphly Lite, you get 1 user, 2 dashboards, and access to our 10 most widely used report templates. These templates include:
- Tags Applied
- Tags Applied Goal
- Leads
- Gross Revenue
- Appt | Note | Task Summary
- Email List Health
- Refunds
- Campaign Email Stats
- Text Widget Area
If you don’t already have a Graphly account, click here to get a Graphly Lite account so you can start making more informed decisions and grow your business.


