This template displays the number of contacts in a list of grouped tags over a given date range. Use the report to quickly and easily measure the conversion of any process in your business; whether it’s marketing, sales, fulfillment, or customer service.
Setting Up the Grouped Tags Funnel Report
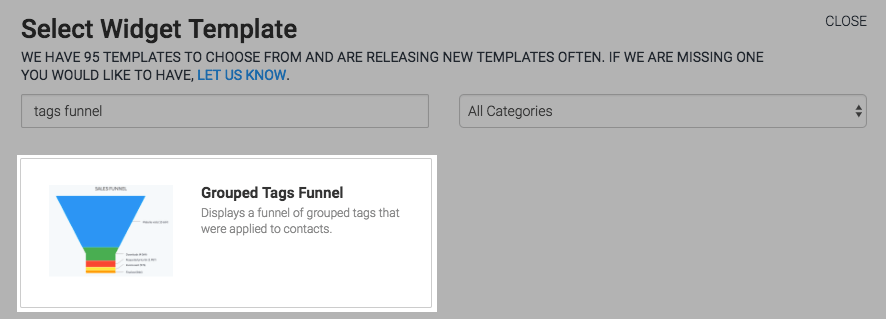
To begin, click the “+” icon on the Dashboard and type “Tags Funnel” into the search bar. Then select the “Grouped Tags Funnel” template.
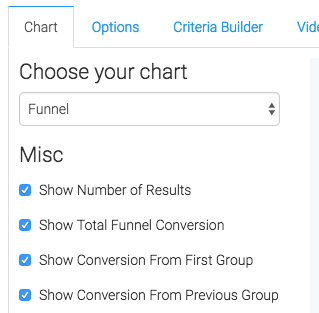
There is only one chart type to choose from, which is funnel. There are also numerous data points that you can include in the chart. You can check any of the corresponding boxes to show the Number of Results, Total Funnel Conversion, Conversion From First Group, and Conversion From Previous Group.
Now navigate to the “Options” tab, and add your first group by typing its name into the bar and clicking the “add” icon. You’ll need to keep doing this to add more groups.
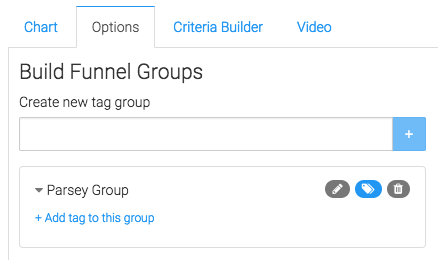
Then add tags to the group by clicking “Add tag to this group” and typing the tag name into the search bar. Then click the “Add” button. You can add as many as you’d like, and move the order of the groups around by clicking and dragging them. You can also edit your group’s name by clicking on the “pencil” icon.

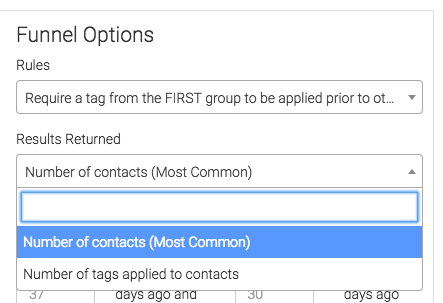
Next, under the Funnel Options Section, select the value you want to track. Number of contacts is the most common.
Then select your date range. This is one of the few instances within Graphly in which there are three date fields.
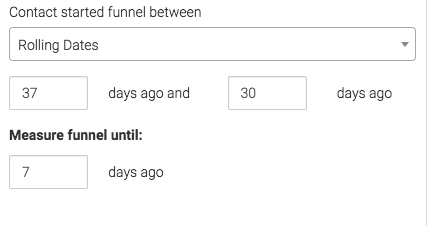
It’s important to note that in order for a contact to display in this funnel they do need to have entered the funnel by having received a tag from the first group in your list first.
Criteria Builder
For ultimate control and customization, use the “Criteria Builder” to include additional rules and requirements to the report.

Once you have everything set, click “Save Preferences” on This Widget.
Now that you’ve set up this report check out some of our other funnel reports below! Go ahead and give this article a rating to let us know how we’re doing!
