

The Facebook/Infusionsoft Highlights Template gives you a quick snapshot of the following metrics, Revenue, costs, profit, CPL, EPL, ROI, new customers, repeat customers, average revenue, clicks, leads and sales.
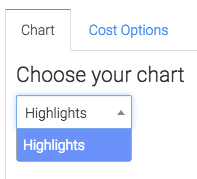
Chart Tab
From the Chart tab, you’ll see this report only has one type.
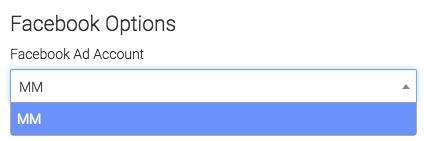
Options Tab
First, we need to select the Facebook account we would like to build the report for.
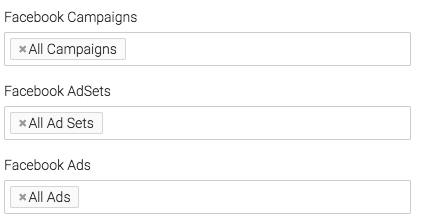
Next, we can narrow our results by look at specific campaigns, ad sets, and ads.
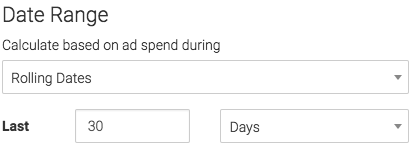
Next, we will choose our date range for when money was spent on ads.
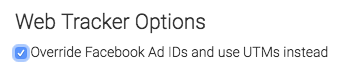
By default Graphly will use the Facebook ad ID’s, while rarely needed, Graphly allows you to override Facebook Ad IDs and use UTMs instead by checking this box.
Revenue Options Tab
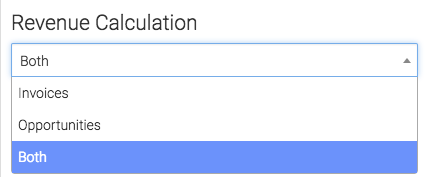
This tab pulls in revenue recorded in infusionsoft. We can calculate the revenue using Invoices, Opportunities, or both.
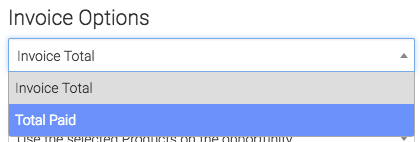
Under the Invoice Option we have Invoice Total and Total paid.
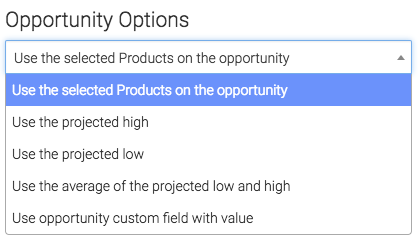
Now let’s look at the opportunity options, we can count revenue based on the products added to the opportunity, use the projected high, use the projected low, average the projected low and high or use the opportunity custom field with value.
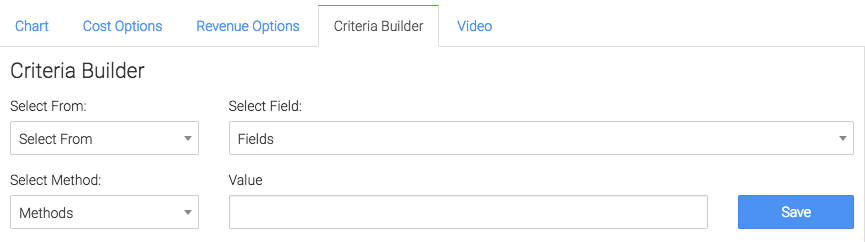
Criteria Builder Tab
To add additional specifications to your report use the Criteria Builder tab.
Relevant Articles to Facebook/Infusionsoft Highlights
- Facebook Ads Reporting with Graphly Setup Guide
- The Facebook CAC vs EPC Graphly Report
- How to Configure the Facebook Cost vs Revenue Report
Create Your Free Graphly Dashboard
You don’t need to struggle to find the data you need from your Infusionsoft or Keap application. Create a free visual dashboard using the Graphly Lite plan. Using Graphly Lite, you get 1 user, 2 dashboards, and access to our 10 most widely used report templates. These templates include:
- Tags Applied
- Tags Applied Goal
- Leads
- Gross Revenue
- Appt | Note | Task Summary
- Email List Health
- Refunds
- Campaign Email Stats
- Text Widget Area
If you don’t already have a Graphly account, click here to get a Graphly Lite account so you can start making more informed decisions and grow your business.


