

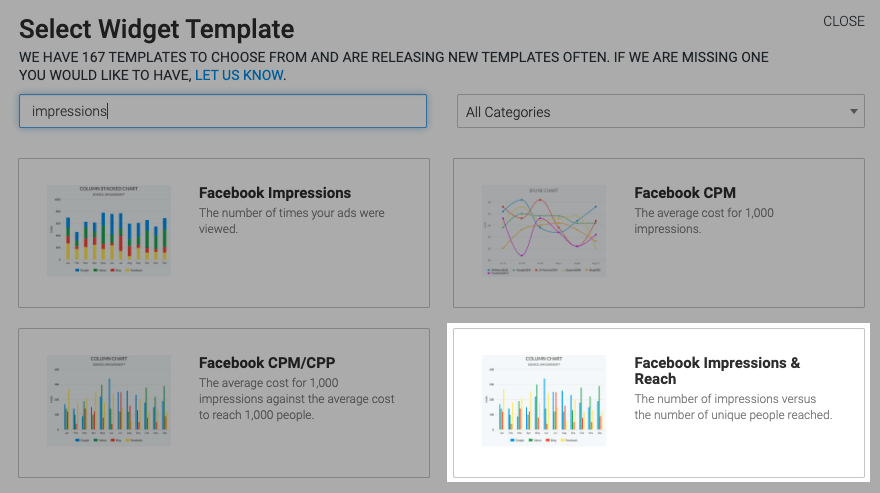
This template shows the number of Facebook impressions verses the number of unique people reached.
Setting Up the Facebook Impressions & Reach Report
As with all reports, you first need to click on the “+” icon in the top right-hand corner of your Graphly dashboard. Type “impressions” into the search bar and click on the “Facebooks Impressions & Reach” template.
In the chart tab there are six different chart types.

We also have the ability to show the total amount spent by checking the box under Misc.
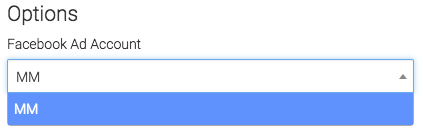
Now let’s go to the “Options” tab. First we need to select the Facebook account which we want to pull from.
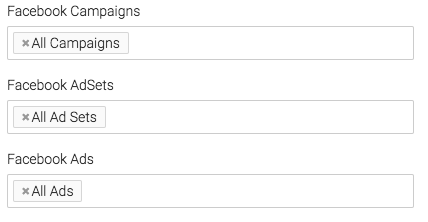
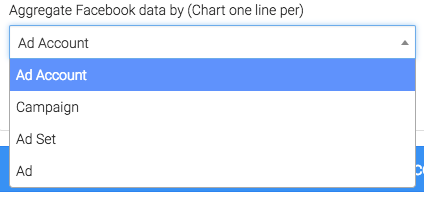
Next we can narrow our results by looking at specific campaigns, adsets, and ads.
Under the aggregate data tab, a unique line will be created for the option we select.
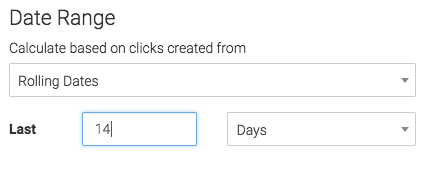
Lastly, you’ll want to choose the date range that you’d like to pull from.
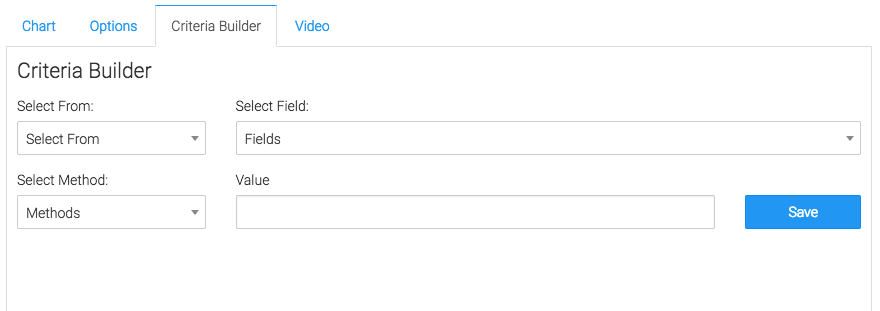
Criteria Builder
For ultimate control and customization, click the “Criteria Builder“. Here you can set rules on your report to filter results by any field on the contact record.
Relevant Articles
Create Your Free Graphly Dashboard
You don’t need to struggle to find the data you need from your Infusionsoft or Keap application. Create a free visual dashboard using the Graphly Lite plan. Using Graphly Lite, you get 1 user, 2 dashboards, and access to our 10 most widely used report templates. These templates include:
- Tags Applied
- Tags Applied Goal
- Leads
- Gross Revenue
- Appt | Note | Task Summary
- Email List Health
- Refunds
- Campaign Email Stats
- Text Widget Area
If you don’t already have a Graphly account, click here to get a Graphly Lite account so you can start making more informed decisions and grow your business.


