

This template shows the average cost for 1,000 impressions. vs the average cost to reach 1,000 people, otherwise known as CPM/CPP
Chart Tab
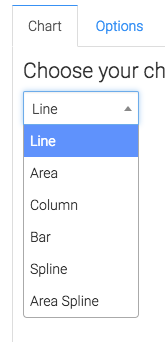
CPM/CPP – Display Type
In the chart tab you’ll see there are six display types.
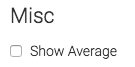
CPM/CPP – Miscellaneous
We have the ability to show the overall average in the top right corner by checking this box.
Options Tab
Now let’s head over to the Options tab.
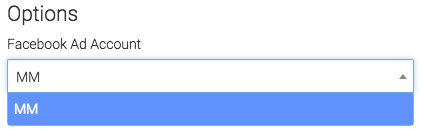
CPM/CPP – Facebook Options
First, we need to select the account you want to build the report for.
Next, we can narrow our results by looking at specific campaigns, adsets, and ads.
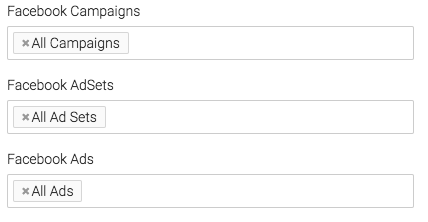
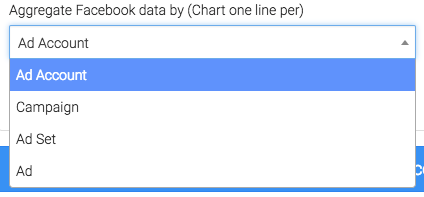
Under the Aggregate data section, a unique line will be created for the option we select.
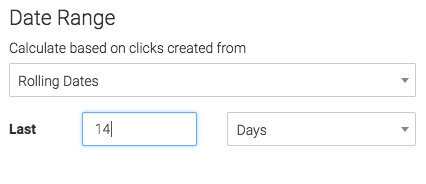
Date Range
On the right hand side, we will choose the date range we want to display.
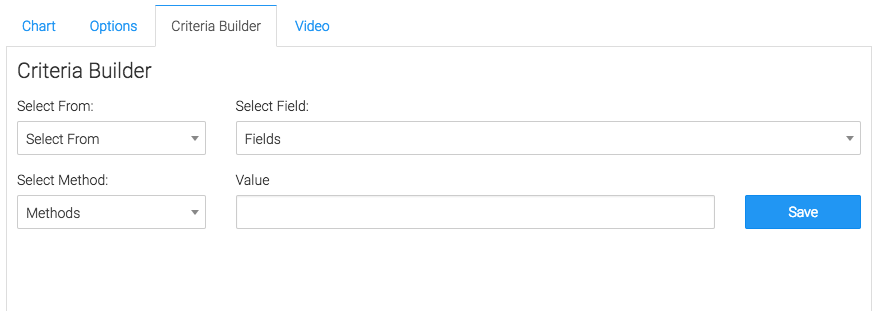
Criteria Builder Tab
For ultimate control and customization, use the Criteria Builder tab. This allows you to filter the report down even further.
Congratulations, you have now configured the Facebook CPM/CPP report.
Relevant Articles
If you don’t already have a Graphly account, you can sign up for free here to get powerful Infusionsoft reporting.


