

This template allows you to compare the cost per lead to the earnings per lead, revealing your true ROI.
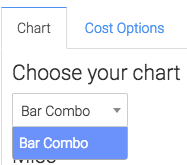
Chart Tab
From the “Chart” tab you’ll see that this chart is a Bar Combo.
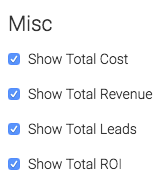
Miscellaneous Options
Below that, we have the ability to show the total cost, revenue, leads and ROI in the upper right hand corner by checking these boxes.
Cost Options
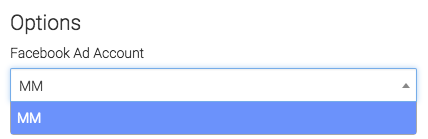
Now let’s go to the “Cost Options” tab.
First, we have to select the Facebook account we would like to build the report for.
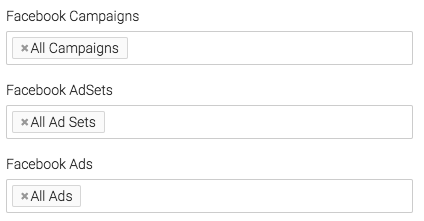
Facebook Options
Next, we can narrow our results by looking at specific campaigns, ad set, and ads.
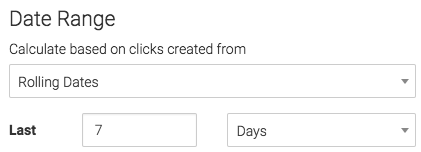
Date Range
Next, we can choose our date range for when money was spend on advertisements.
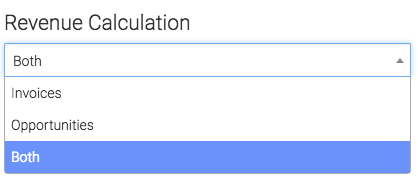
Revenue Options
Now let’s go to the “Revenue Options” tab.
This tab pulls in revenue recorded from Infusionsoft using Invoices, opportunity records or both.
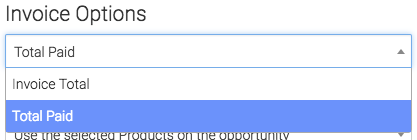
Invoice Options
Under the “Invoice options” we have Invoice Total and Total Paid.
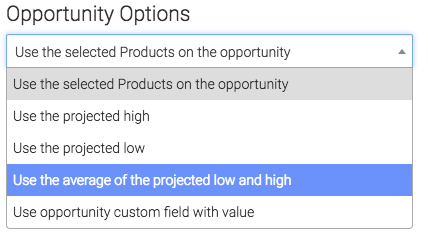
Opportunity Options
Under the “Opportunity Options” we can use the selected Products on the opportunity, use the projected high, use the projected low, use the average projected low and high, or use an opportunity custom field with value.
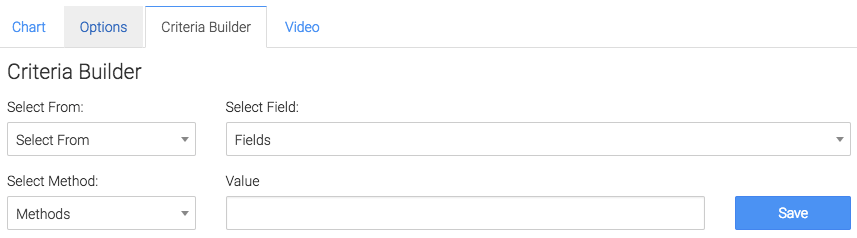
Criteria Builder
To add additional specifications to your report use the Criteria Builder tab.
Relevant Options
If you don’t already have a Graphly account, you can sign up for free here to get powerful Infusionsoft reporting.


