This template gives you a simplified view of milestone events linked to your ads.
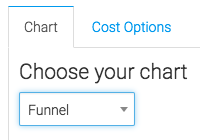
From the chart tab, you’ll see this chart can be viewed as a column or a funnel.
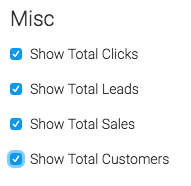
Below that, we can show the total cost, revenue, leads, and ROI at the top by checking these boxes.
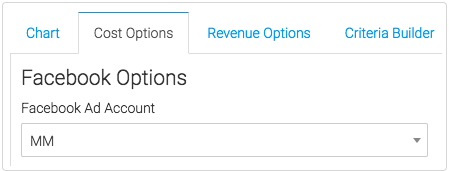
Now let’s go to the cost “Options” tab.
First, we need to select the Facebook we want to use.
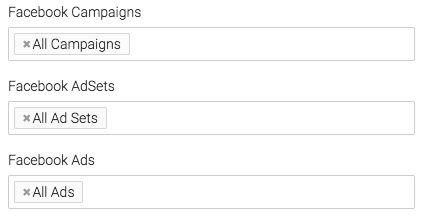
Next, we can narrow our results by looking at specific campaigns, ads, and adsets.
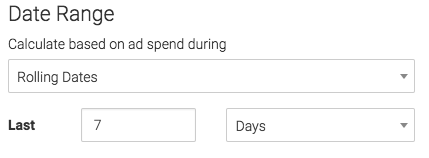
Now we can select the date range.
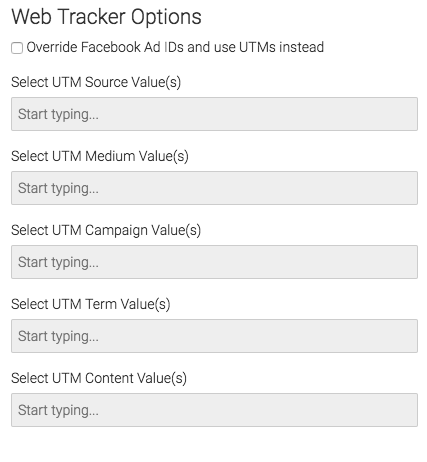
By default, Graphly will use the Facebook ad ID’s associated with the correct expenses with each ad.
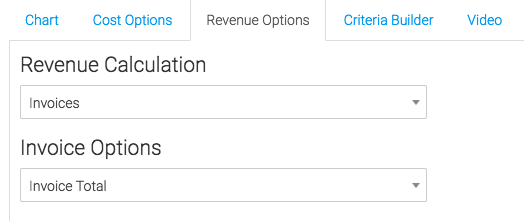
Now let’s go to the “Revenue Options” tab.
This tab pulls in revenue recorded in Infusionsoft.
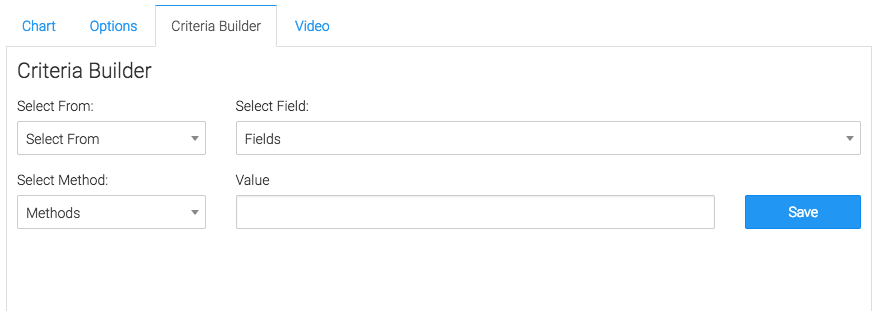
For ultimate control and customization, use the “Criteria Builder“.