

The Facebook Clicks template shows the number of clicks on your ads, ad sets, or campaigns.
Search for the Report
To begin, click the “+” icon on the Dashboard and type “Facebook Clicks” into the search bar. Then select the “Facebook Clicks” template.
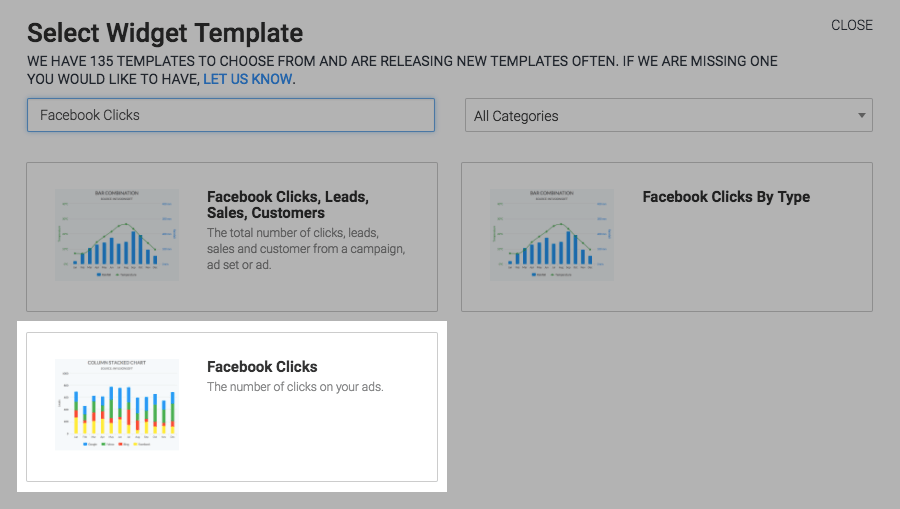
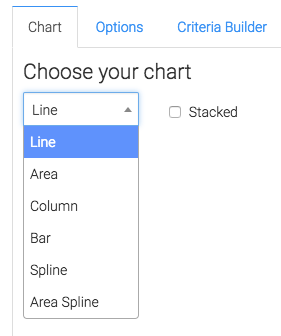
Chart Tab
From the chart tab you’ll see that there are six different chart types to choose from.
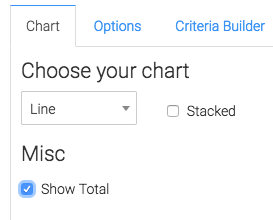
You also have the ability to show the total number of clicks in the top right corner by checking the box.
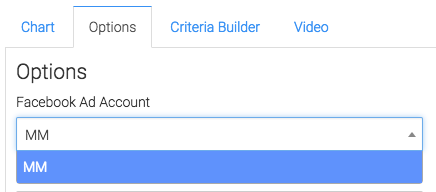
Options Tab
Select the Facebook account you would like to build the report for.
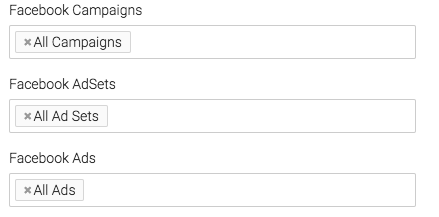
Next, you can narrow your reports by looking at specific campaigns, ad sets, and ads.
You can also leave these three fields to All to see everything.
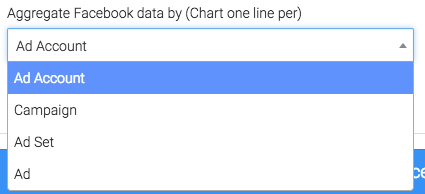
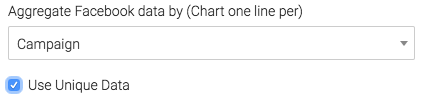
Under the aggregate data section a unique line will be created for the section you select.
At times there are events that are triggered from the same Facebook user, if you’d like to exclude repetitive actions taken by the same user, then check this box.
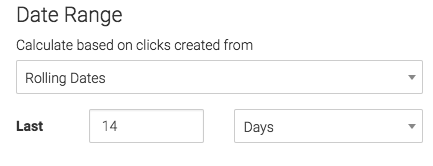
Now you can select the Date Range.
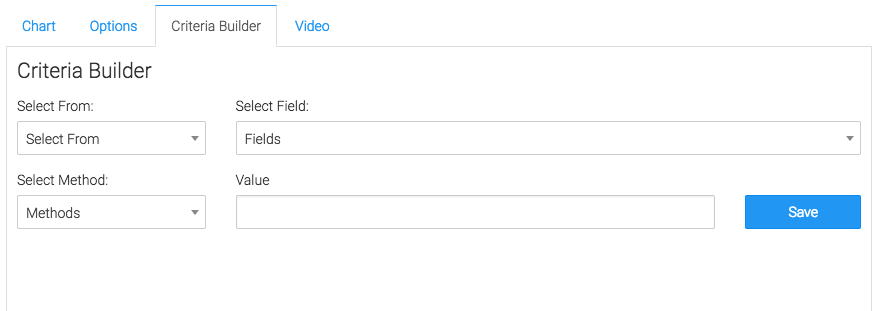
Criteria Builder Tab
For ultimate control and customization click the Criteria Builder tab.
Relevant Articles
- Facebook Ads Reporting with Graphly Setup Guide
- How to Set Up the Facebook CPM/CPP Report
- Facebook Device Platform Breakdown
Create Your Free Graphly Dashboard
You don’t need to struggle to find the data you need from your Infusionsoft or Keap application. Create a free visual dashboard using the Graphly Lite plan. Using Graphly Lite, you get 1 user, 2 dashboards, and access to our 10 most widely used report templates. These templates include:
- Tags Applied
- Tags Applied Goal
- Leads
- Gross Revenue
- Appt | Note | Task Summary
- Email List Health
- Refunds
- Campaign Email Stats
- Text Widget Area
If you don’t already have a Graphly account, click here to get a Graphly Lite account so you can start making more informed decisions and grow your business.


