This template allows you to compare the cost to acquire a customer or the customer acquisition cost to your earnings per customer, revealing your true ROI on your Facebook marketing strategies.
General Setup for the Facebook CAC vs EPC Report
As usual, click on the “+” icon up in the top right-hand corner of the Graphly dashboard. Then type “Facebook CAC” in the search bar and click on the widget to add it to your dashboard.
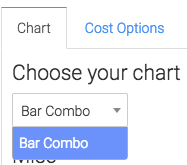
From the Chart tab you’ll see this chart is only displayed in a Bar Combo.
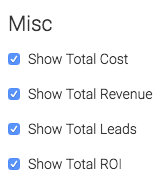
Below that, we have the ability to show the total cost, revenue, leads and ROI by checking these boxes. This will display in the corners of the report.
Now let’s head to the “Options” tab.
Here we have to select the Facebook account we would like to build the report for. You will have had to connect Graphly to Infusionsoft by this point. If you haven’t click here to find out how you can do that.

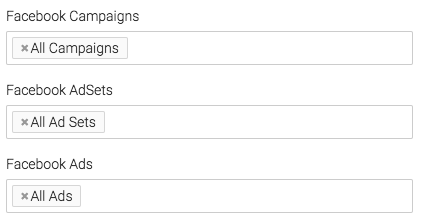
Next, we can narrow our results coming in from Facebook by setting Graphly to look a at specific campaigns, ad sets and ads.
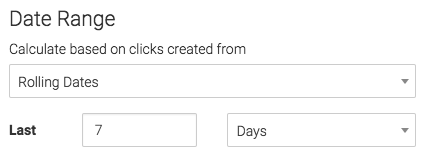
Next, we will choose our date range for when money was spent on ads.
Now lets go to the “Revenue” Options tab.
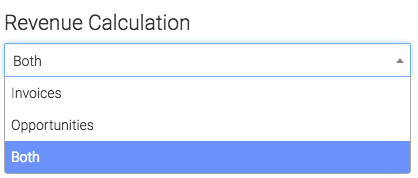
This tab pulls in revenue recorded in infusionsoft. We can calculate revenue using Invoices, Opportunity records or both.
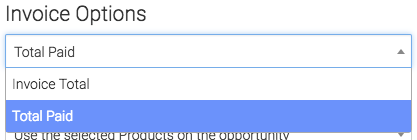
Under the Invoice options we have the choice for Invoice Total or Total Paid.
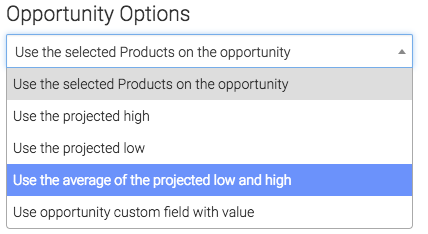
Under the “Opportunity Options“, we can use the selected Products on the opportunity, use the projected high, use the projected low, use the average of the projected low and high, or use the opportunity custom field with value.
Criteria Builder
To add additional specifications to your report use the “Criteria Builder“. This can be used to filter contacts based on any field in Infusionsoft!

If you like how we report on Facebook, help us out by giving us a five-star review on the Infusionsoft store.

