

The Days Between Tags template calculates the number of days between tags getting applied.
Search for the Days Between Tags Teplate
To begin, click the “+” icon on the Dashboard and type “tags” into the search bar. Then select the “Days Between Tags” template.
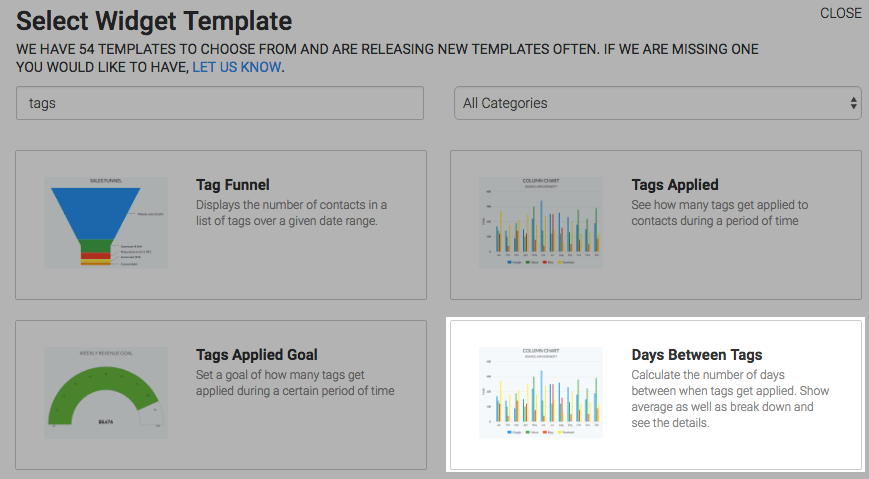
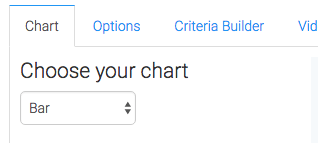
Chart Tab
There are two chart types, column and bar. I’ll use bar.
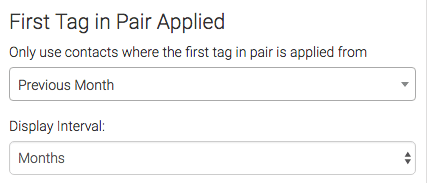
Options Tab
Navigate to the Options tab and build your tag pairs.
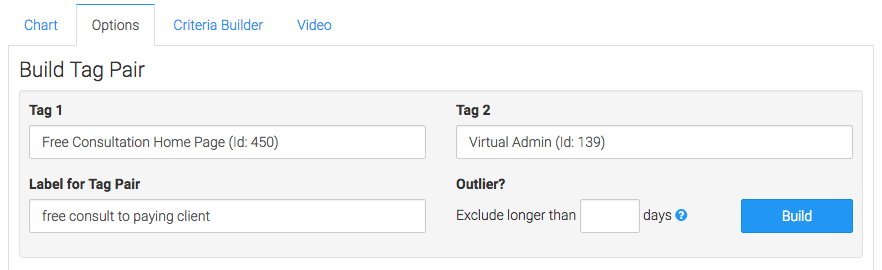
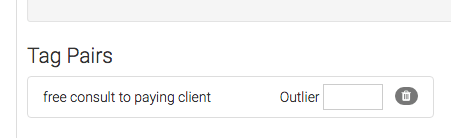
After entering the information click Build. You can repeat this process as many times as needed.
Then choose your date range.
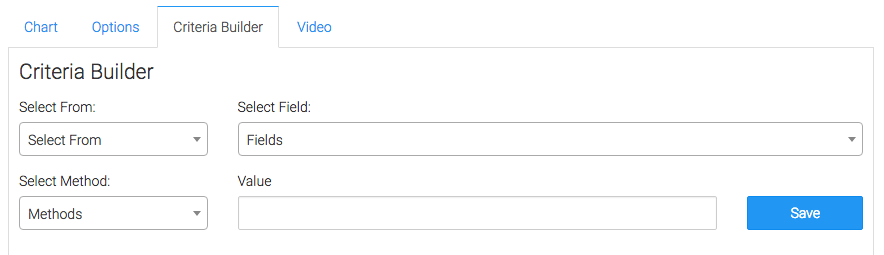
Criteria Builder Tab
For ultimate control and customization, use the Criteria Builder to include additional rules and requirements to the report.
Once you have your everything set, click Save Preferences on This Widget.
Relevant Articles
- How to Configure the Graphly Tag Funnel Report
- How to Set Up the Tag Leaderboard Report
- How to Configure the Tag Totals Report
Create Your Free Graphly Dashboard
You don’t need to struggle to find the data you need from your Infusionsoft or Keap application. Create a free visual dashboard using the Graphly Lite plan. Using Graphly Lite, you get 1 user, 2 dashboards, and access to our 10 most widely used report templates. These templates include:
- Tags Applied
- Tags Applied Goal
- Leads
- Gross Revenue
- Appt | Note | Task Summary
- Email List Health
- Refunds
- Campaign Email Stats
- Text Widget Area
If you don’t already have a Graphly account, click here to get a Graphly Lite account so you can start making more informed decisions and grow your business.


