IMPORTANT NOTE: Currently this Email Engagement report no longer displays Opened metrics. This is because of a change that email providers have made that doesn’t allow the pixel placed in the email to trigger the Infusionsoft automation link that applies the Opened tag.
General Setup
This report template shows the best combinations of Days and Times to send emails to your list. Start by clicking the “+” icon on your dashboard. Then type “Daily” into the search bar and click the “Daily & Hourly Email Engagement” Widget.
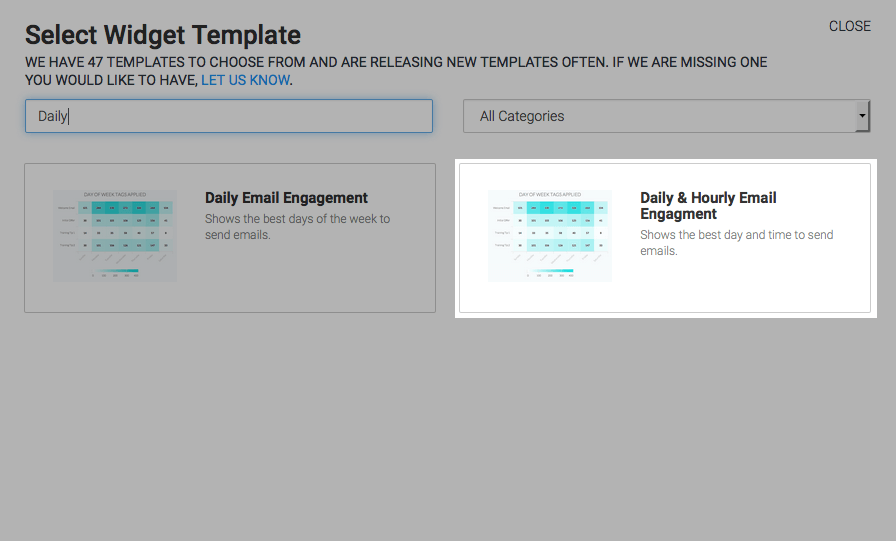
This report is only displayed as a Heat Map. Go to the “Options” tab and choose all of your Open or Click tags that you want to measure for email engagement.
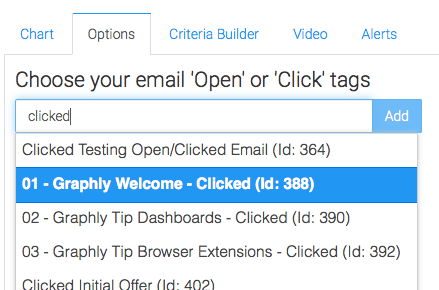
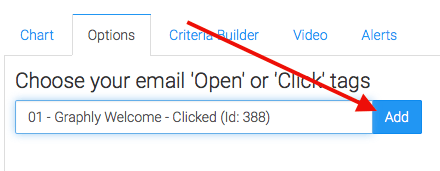
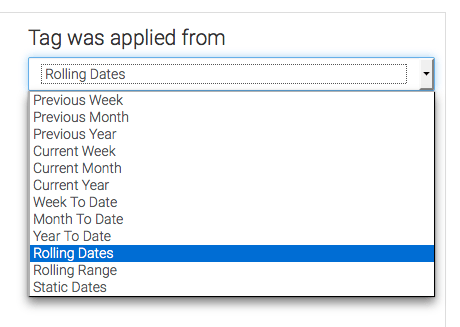
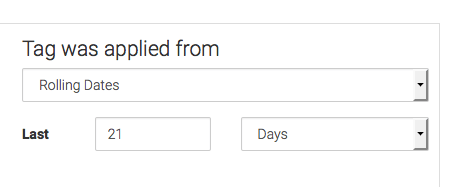
Next, define the time frame you wish to look at based on when the opens or clicks took place. In other words, when the tag got applied. I’m going to leave this as Rolling Dates, but set it to look at the last 21 Days. That way I’m looking across a few weeks as opposed to one, ultimately supplying me with more data that is more accurate.
Criteria Builder and Alerts
For ultimate control and customization, use the Criteria Builder to include additional rules and requirements to the report. This way you can filter out certain contacts for any reason you can imagine.

Lastly, feel free to set alerts in the Alerts tab for if your values rise above, or fall below a threshold of your choosing.

Once you have your alerts set, click “Save Preferences” on This Widget and your done!
Now that you’re finished here, take a look at some of our other articles about email reporting! If you like our reporting, help us out by leaving a five-star review on the Infusionsoft store!


