IMPORTANT NOTE: Currently this email engagement report no longer displays Opened metrics. This is because of a change that email providers have made that doesn’t allow the pixel placed in the email to trigger the Infusionsoft automation link that applies the Opened tag.
This template shows you the best days of the week to send emails to your specific lists.
Setting Up the Daily Email Engagement Report
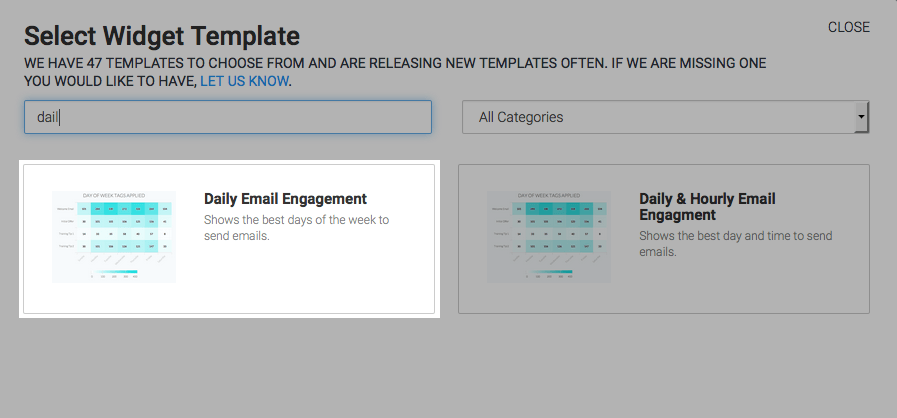
To begin, click the “+” gear icon on your dashboard. Then type “Daily” in the search bar and click on the “Daily Email Engagement” widget.
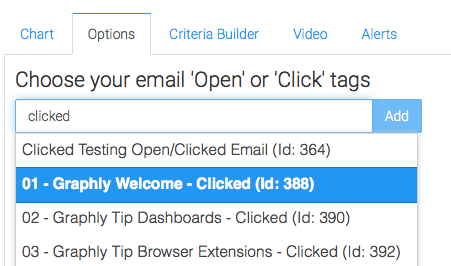
This report is displayed as a Heat Map. Go to the “Options” tab. First, choose all of your open or click tags that you wish to measure.
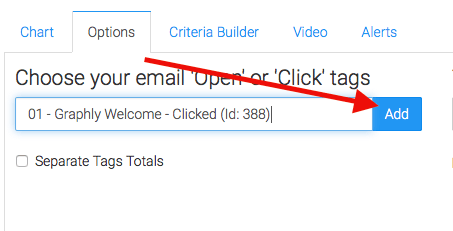
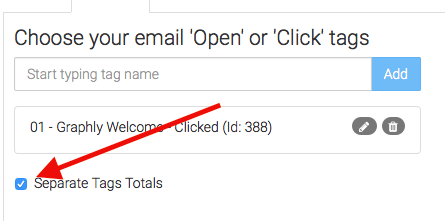
The Separate Tag Totals checkbox greatly impacts the appearance of this report. If you check the box, the chart will look similar to the example on the Chart tab with the emails separate along the left side of the graph. If you leave it unchecked you’ll have a single row joining all of the emails together which would give you a big picture view. This setting just depends on what you’re looking for.
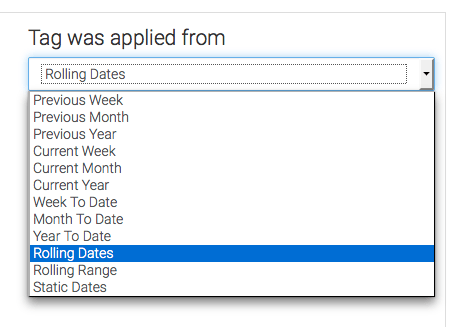
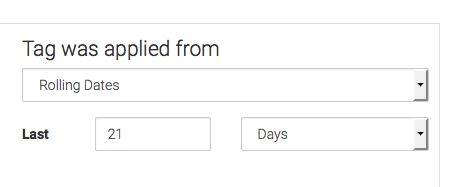
Next, define the time frame you wish to look at based on when the open or click took place. Essentially, when the tag got applied. I’m going to leave this as Rolling Dates, but set it to look at the last 21 Days. That way I’m looking across a few weeks as apposed to one, ultimately supplying me with more data that is more accurate.
For ultimate control and customization, continue using the Criteria Builder to include additional rules and requirements to the report. This way you can filter results based on any field in the contact record.

Lastly, feel free to set alerts in the Alerts tab for if your values rise above, or fall below a threshold of your choosing.

Once you have your alerts set, click “Save Preferences” on This Widget.
Relevent Articles
- How to Configure the Daily & Hourly Email Engagement Report
- Setting Up Email Reporting in Infusionsoft’s Campaign Builder
- How to Set Up the Email Engagement Report
Create Your Free Graphly Dashboard
You don’t need to struggle to find the data you need from your Infusionsoft or Keap application. Create a free visual dashboard using the Graphly Lite plan. Using Graphly Lite, you get 1 user, 2 dashboards, and access to our 10 most widely used report templates. These templates include:
- Tags Applied
- Tags Applied Goal
- Leads
- Gross Revenue
- Appt | Note | Task Summary
- Email List Health
- Refunds
- Campaign Email Stats
- Text Widget Area
If you don’t already have a Graphly account, click here to get a Graphly Lite account so you can start making more informed decisions and grow your business.
